2025 Report: AI in Service
Key Findings from Enterprise Service Leaders
A comprehensive survey revealing how service organizations are implementing AI technologies, the challenges they face, and the strategic approaches driving success in 2025.
and Above
Initiatives
Executive Summary
Six critical insights that define the current state of AI adoption in service organizations


%201%20(1).webp)


— Research Insight from 125 Service Leaders
Leadership Engagement
Service organization leaders are driving AI initiatives with unprecedented involvement


"As a VP/GM overseeing 2,000 colleagues with a $500M P&L, I need AI solutions that deliver measurable impact. We're not interested in experiments—we need operational excellence."
VP/General Manager,
Fortune 500 Service Organization
Organization size: 2,000+ employees
P&L responsibility: $500M+
- C-Suite/VP Level: 42%
- Director Level: 37%
- Senior Manager: 21%
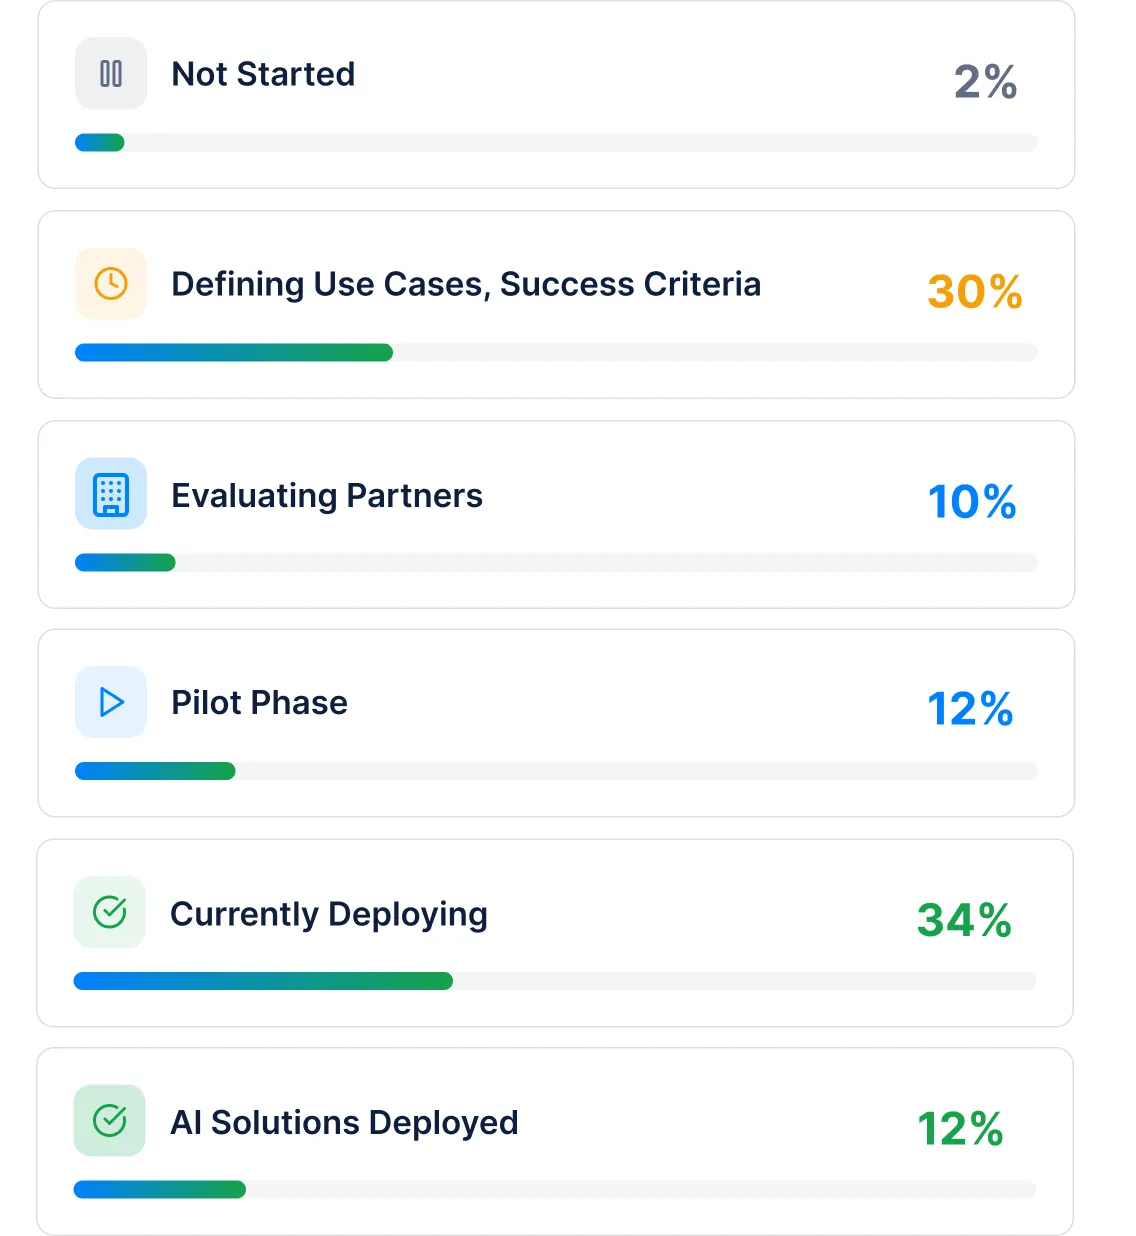
AI Adoption Status
Organizations are moving beyond planning into active deployment phases
Implementation Strategy
Organizations strategically choose high-frequency, low-complexity use cases to start their AI journey
Advanced implementations after proven success
• Complex problem solving
• Multi-step workflows
• Advanced analytics
Preferred starting point for AI implementation
• Automated responses
• Basic routing
• Simple classifications
Rare, complex scenarios typically avoided initially
• Complex edge cases
• Highly specialized tasks
• Custom integrations

Specialized use cases with simple requirements
• Niche processes
• Seasonal tasks
• Exception handling

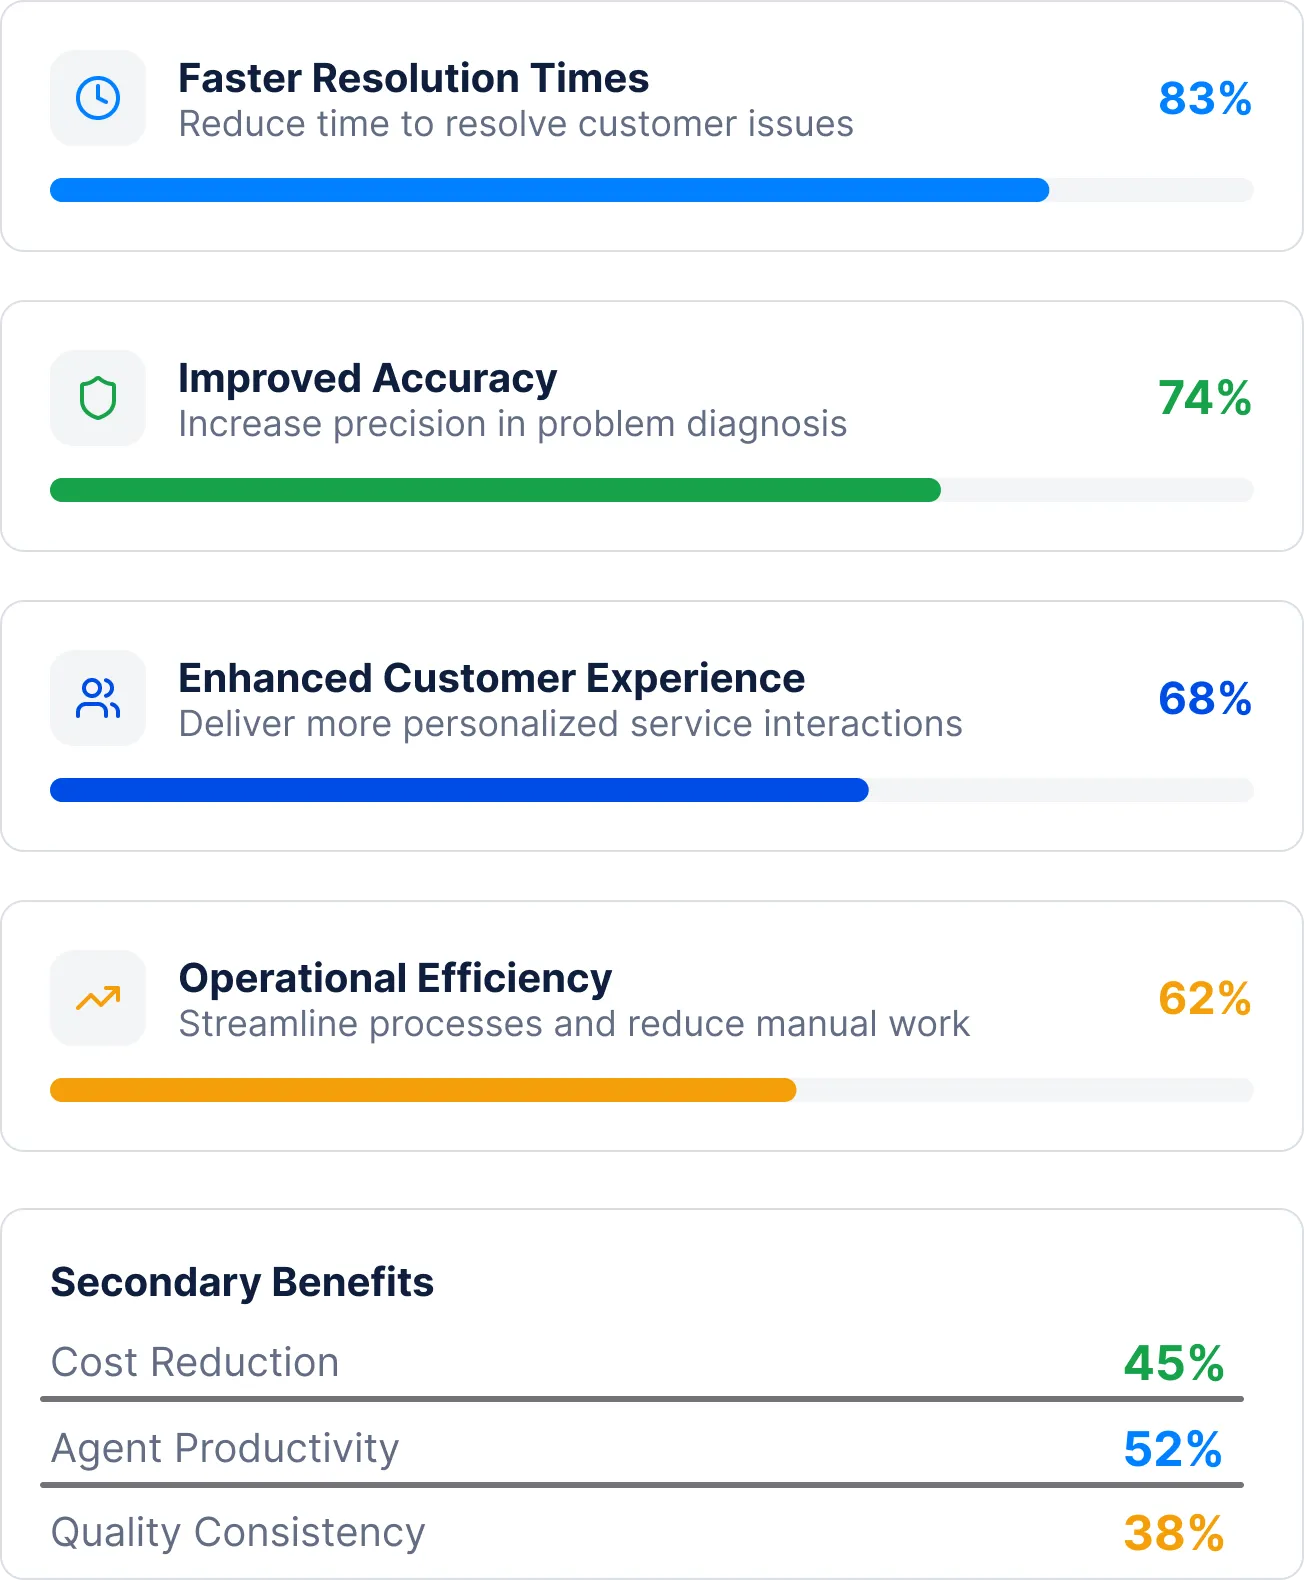
Use Case Priorities
Organizations focus on measurable outcomes that directly impact customer satisfaction and operational metrics
"Our AI implementation prioritizes faster resolutions above all else. When customers get their issues resolved quickly, everything else follows—satisfaction scores, retention, and operational efficiency."
Director of Technical Support
Global Technology Company
Organizations identify faster resolution times as their primary AI success metric
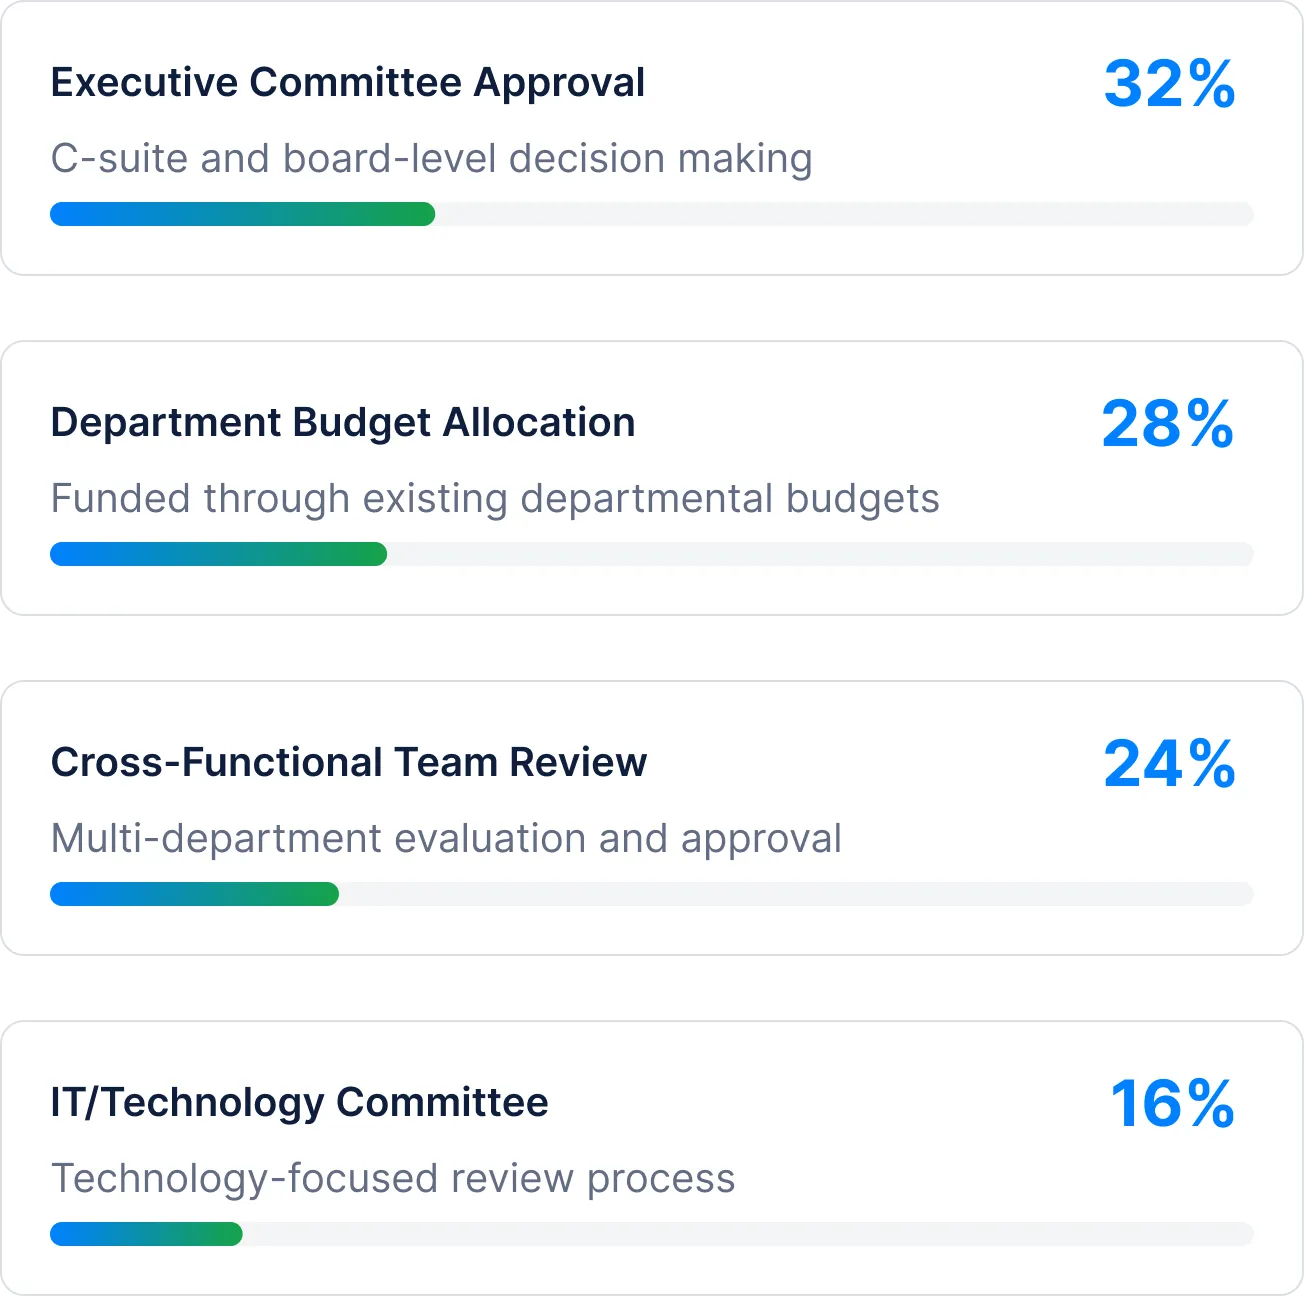
ROI and Purchasing Decisions
Organizations focus on measurable outcomes that directly impact customer satisfaction and operational metrics
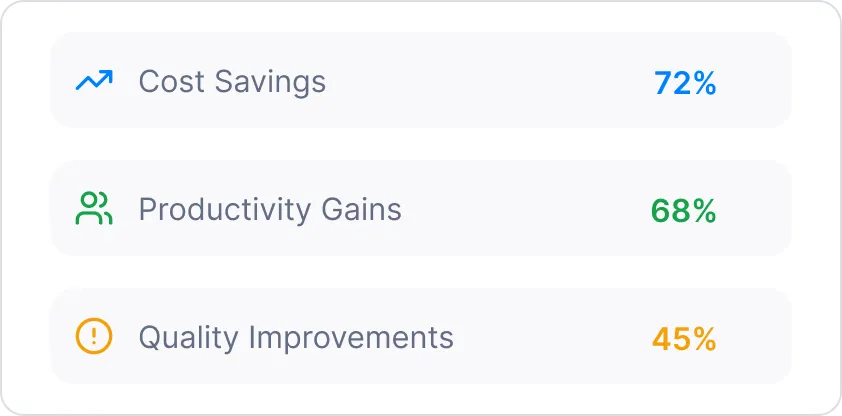
Organizations need measurable, credible ROI projections to secure budget approval
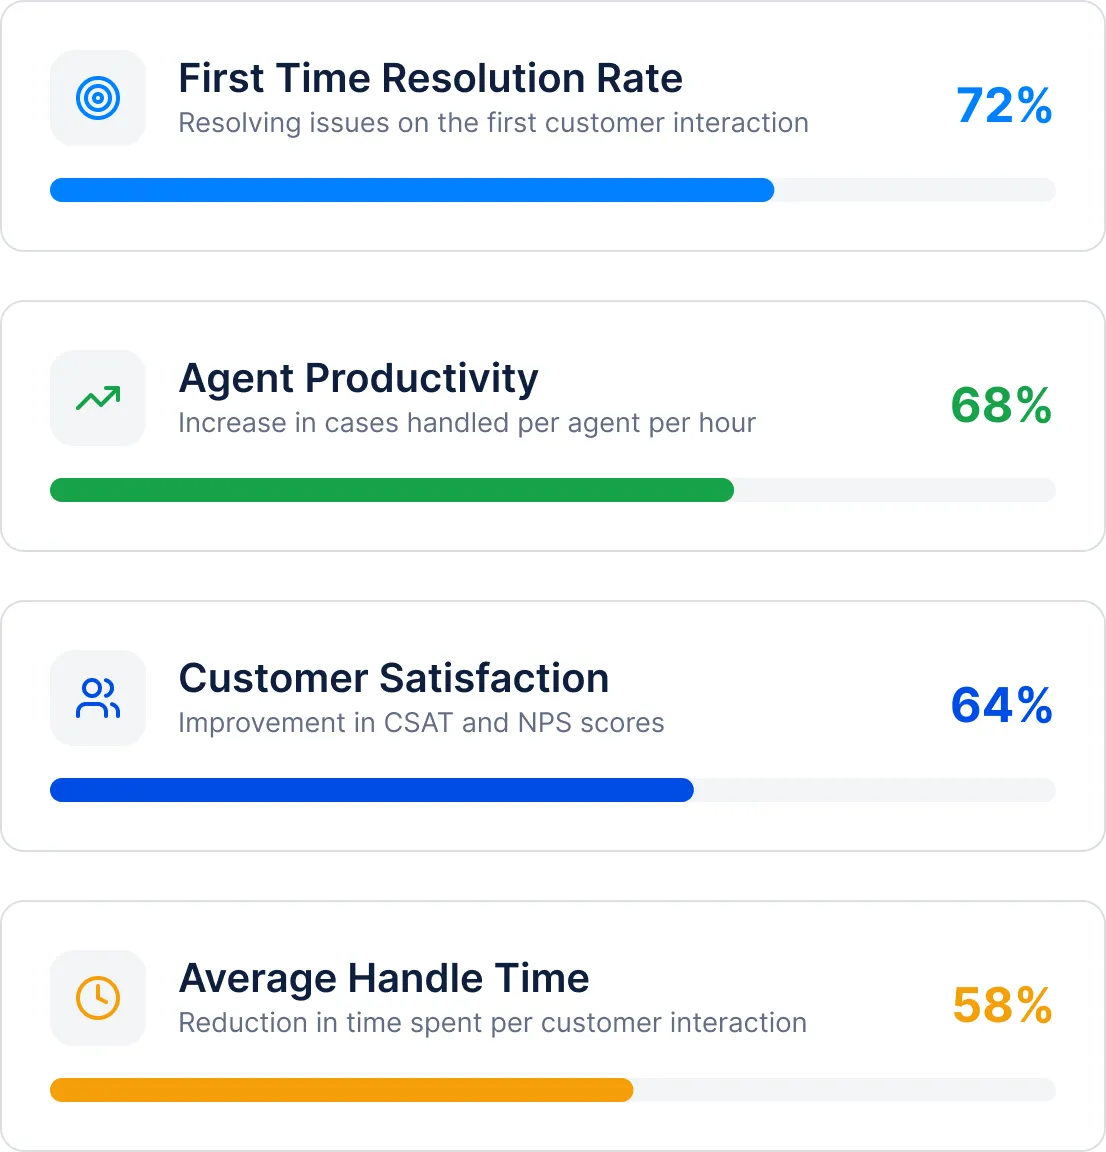
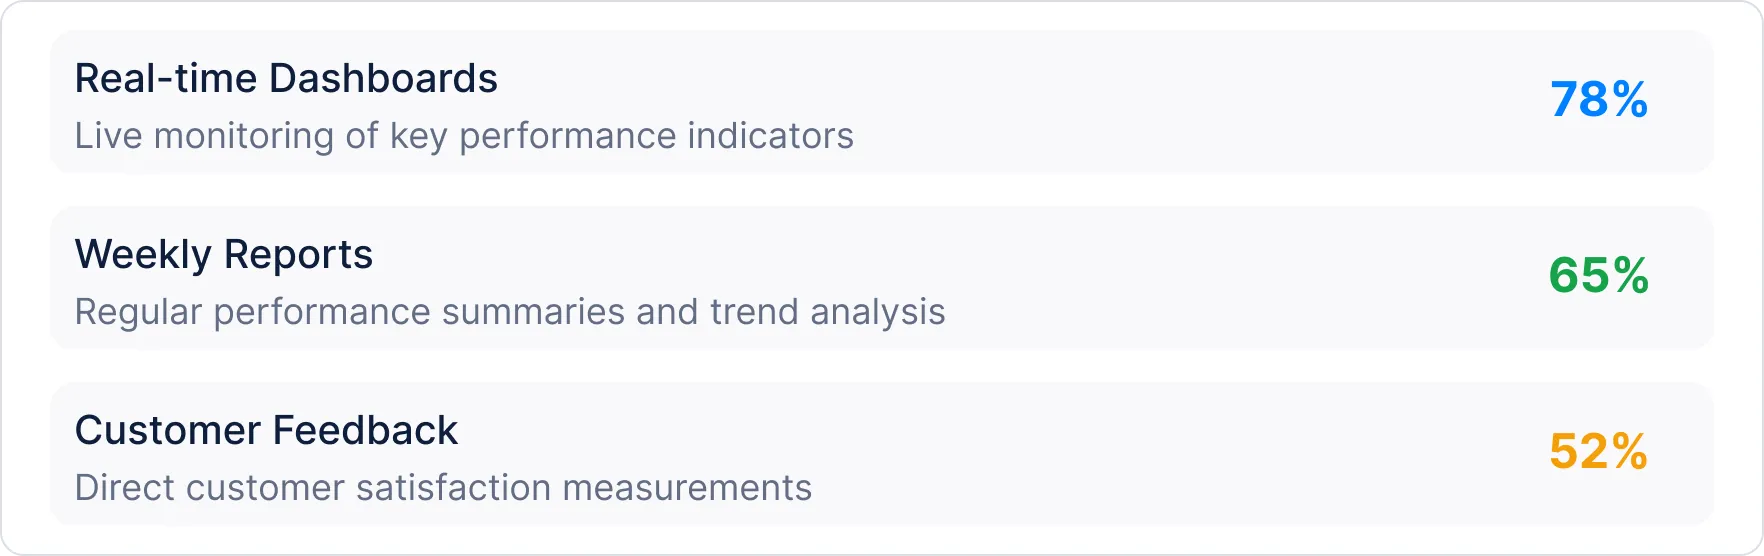
Key Performance Metrics
Organizations track specific metrics to measure AI implementation success
"We use AI to gain deeper insights into customer behavior and preferences. This helps us proactively address issues and deliver more personalized experiences."
Chief Experience Officer,
Service Technology Company
Organizations prioritize solving customer issues on the first interaction
Organizational Diversity
AI adoption spans organizations of all sizes, from mid-market companies to large enterprises
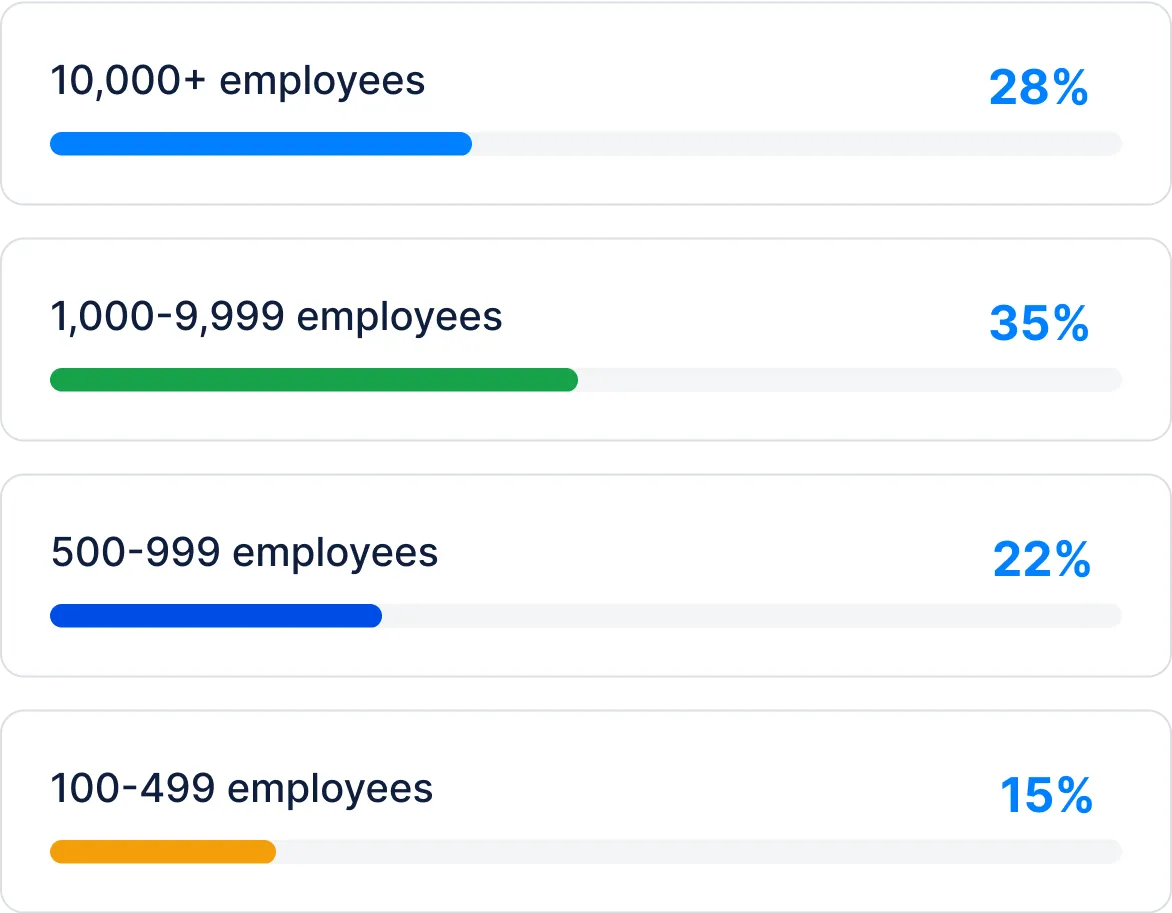
Organizations with 1,000+ employees leading AI adoption

Organizations with $100M+ annual revenue
Research Methodology
• 125 service organization leaders surveyed
• Conducted between November 2024 – January 2025
• 79% director level or above respondents
• Organizations ranging from $10M to $1B+ revenue
• Mix of industries: Technology, Financial Services, Healthcare, Manufacturing
• Structured interviews with validated questionnaire
• Statistical analysis with confidence intervals
• Cross-referenced responses for data integrity
• Anonymous participation to ensure honest feedback
• Results validated by independent research firm